Key SaaS KPIs and How We Optimize Them
Translated from German by FabForward Consultancy.
As a young IT project manager back in 2009, I read about SaaS for the first time. In those days, this subject was brand new: software that doesn’t need to be installed—that sounded almost futuristic. But times have long changed. There is an outright oversupply in the SaaS industry. According to Statista, there were 25,000 SaaS companies globally in 2021, of which 7,000 were in the marketing industry. All the more reason to be aggressive, efficient, and structured in your approach. The beauty of SaaS is that you can measure everything across the funnel. But, in the end, SaaS is just plain math—either the numbers fit, or they don’t. This brings us to the topic of SaaS KPIs.
There are numerous articles concerning this subject. SEO copywriters and freelancers on Upwork write 90% of them, but you can kick those into the bin. Several informative articles have been published, which can be found at the end of this post.
Without claiming completeness or even being a guru, I will write honestly and transparently about which SaaS KPIs we track internally and how we optimize them.
SaaS KPI 1: Traffic
First off, every website needs reasonable traffic. We’ve often seen clients with hardly any traffic wondering why they don’t have website visitor recognition in LeadRebel. Something that does not exist cannot be recognized. Thank God we are blessed with traffic on our end. Our primary sources of traffic are:
- Google Organic (i.e., what comes through the search engines)
- Google Ads (Google Advertising)
- Display Ads (advertising on various networks, again mainly Google)
- Backlinks from other websites (mainly generated through affiliate campaigns)
The top two are far better for conversion rates than the remaining bullet points.
Our goal is to slowly and steadily increase traffic further. Despite fluctuations and seasonality, we have achieved this goal over the last two years. Here’s what we did:
- Our Google Ads budget is fairly consistent, with no significant changes over the last few years. We did increase the funding in parallel with our MRR. Yet, we discovered that increasing the budget does not improve the results (due to the low search volume in our niche).
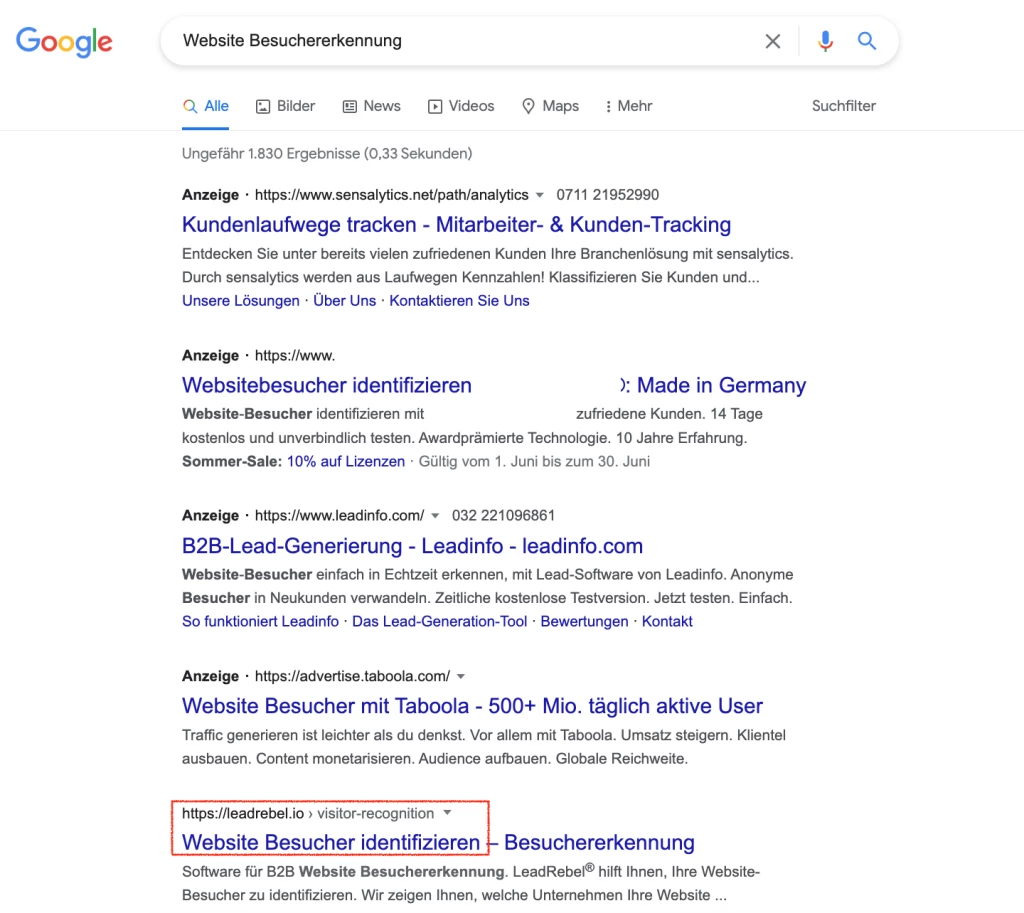
- Search engine optimization is where we can make an impact and have invested a lot of work. We constantly build links and post content on our blog (sometimes very diligently, sometimes less J). We also try to keep the technical aspect of our website in good shape.
Example:

Permanent link building also increases referral traffic, but this only plays a secondary role for us.
My recommendation: SEO is slow, and you don’t see the results right away, but over the medium to long term, “slow and steady wins the race.”
We’re not SEO specialists and put our pants on one leg at a time, but there is one takeaway:
- Building links
- Generate content (blog articles, new landing pages, etc.)
Both simply cannot be ignored. But, again, you don’t have to be an SEO guru to do that. Just pay for it with money or with time.
SaaS KPI 2: Traffic Conversion Rate
This is an incredibly annoying SaaS metric (but very relevant to e-commerce). This SaaS KPI fluctuates a lot and is hard to influence, especially if you try to do it part-time (and yes, that’s what we do 🙂). There are numerous tools and services specialized in optimizing traffic conversion rates. The whole thing is a science in itself, and I admit we don’t always understand it ourselves. Nevertheless, we recommend the following tools:
- Personyze: a software that customizes your website (e.g., headlines) based on visitor data (e.g., city, country, or even industry). This software works best in combination with LeadRebel
- Hotjar: a software that analyzes visitor behavior on your website, creates heatmaps and records video recordings of visits (analogous to LeadRebel).
- Unbounce: a tool to create highly optimized landing pages
- Optimizely: best-suited for A/B testing
The traffic conversion rate is the rate of prospects converted into trial accounts. We’ve seen everything from 0.25% to 4% in recent years. That means there were months when only 0.25% of all visitors opened an account, and there were months when that number reached 4%! (correspondingly, July and October, plain seasonality). On average, we are at 1.4%, our target is 2%, and it is clear that we are still a long way off.
From our perspective, conversion rates are mainly influenced by:
- Seasonality (summer and December weak, as generally in B2B)
- Traffic Relevancy. It matters whether the traffic is relevant or irrelevant. For us, organic traffic and Google Ads traffic from the German-speaking region is relevant and converts well. So, you have to observe the traffic quality and conversion rate as a whole, not separately. Otherwise, you will get a distorted picture.
- Responsiveness and a nice-and-tidy UI, both in mobile and desktop view
- Clear and well-placed call-to-action
- Wording, clear messages
- Straightforward sign-up/order process with just a few clicks, easy-to-use user interface
- The trust factor, i.e., references, reviews, customer feedback
- Lead magnet: an offer on the website (not your product or service) which is free of charge to visitors, but in return, you receive an email address from the prospect (e.g., free consultation, a PDF document with “best practices from …”)
- We keep generating new leads via online chat
- We are also experimenting with exit banners, product-related landing pages, and primitive A/B testing
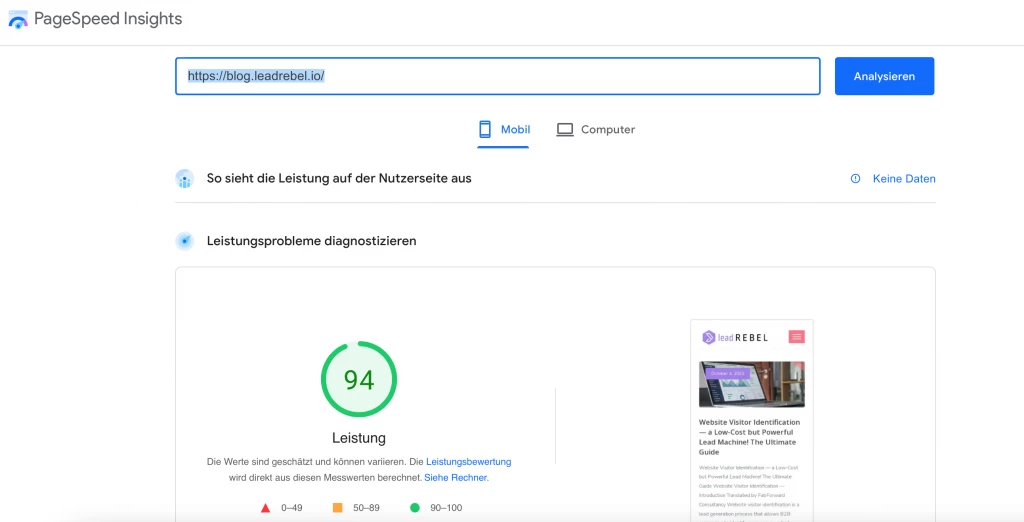
- website speed (critical). Here is what it should look like:

One thing that helps our clients and us with trial conversion rates is—you guessed it—LeadRebel! By deanonymizing visitors, we have an opportunity to proactively target companies that otherwise would not have contacted us themselves. You can read here about how it works and its effects.
SaaS KPI 3: Trial Conversion Rate
Again, that’s one of the SaaS metrics we like and can be proud of. It’s about what percentage of trial accounts convert to a paid subscription. We stand at 25% and reach over 30% in good months. But again, summer is terrible, while Jan-June and Sep-Nov are good.
What is the reason for our (relatively) reasonable rate? It’s first and foremost because of our excellent product. It seems complicated to convince people to sign up (see SaaS Metric Traffic Conversion), but once registered, customers like our product (except for those with low traffic). Yet, we also take additional measures to keep the rate at a decent level. These are:
- Offering product demos. Early in the funnel, we offer a demo session and try to better explain our product to our prospects or customers. Experience shows that such customers are more inclined to subscribe. To learn more about buyer’s journey and why it is important for your sales, read this guide: Buyer’s Journey: How to Target the Stages.
- Full-featured trial version. We do not hide anything behind a paywall but offer our product in full and free of charge for 14 days. This makes it easier to assess the product value.https://leadrebel.io/de/signup
- Keep customers happy with automatic email notifications. During the trial period, I will send several automated emails to them, and some chosen customers will receive extra personalized emails from us.
- Welcome call. We try to establish an interpersonal relationship with our customers early in the sales process. Of course, it goes without saying that this is important.
- Newsletter. All registered customers receive a standard newsletter from us in which we explain our product step by step, present various integrations, point out partnership opportunities, and so on. We create them using Sendpulse, but plenty of other automation tools are available.https://sendpulse.com/
- Implementing customer requests: We are probably one of the few companies implementing technical add-on requests from customers not yet subscribed. It positively affects the customers’ readiness to buy.
SaaS KPI 4: Average Ticket Size
The increase in average ticket size can at least partly offset failures elsewhere in the funnel. By average ticket size, we mean the average order amount per sales order.
One of the positive characteristics of SaaS is that this metric tends to increase over the years. There are many reasons, like improved product quality, increased willingness to upsell among the existing customer base, broader acceptance in the market, trust factor, etc.
We also saw a significant increase in the average ticket size over the last two years, either due to gradually increasing the package prices or charging per extra user. We also optimized our sales and focused mainly on high-ticket customers.
Interim conclusion: A mix of four SaaS KPIs
We intentionally focus on these four KPIs because everything else is based on them.
- For example, the number of leads per month is calculated as a function of traffic and trial conversion rate;
- The cost per lead is calculated according to the monthly budget divided by the number of leads;
- The cost per acquisition (= paying customers) is a function of traffic conversion rate and trial conversion rate, in combination with advertising spend
In other words, you leverage the entire funnel by optimizing the key parameters. Calculation example:
- 3000 visitors/month * 1% traffic conversion rate * 20% trial conversion rate * 300 Euro Average Ticket = 1800 Euro MRR per month
If you increase each factor by just 10%, the result looks very different:
- 3400 visitors/month * 1,1% traffic conversion rate * 22% trial conversion rate * 330 Euro Average Ticket = 2635 Euro MRR per month (46% increase).
It all sounds simple in theory, but it involves a lot of time, trial-and-error, and learning. A sustained increase in all SaaS KPIs will be gradual, and setbacks often occur. So, don’t get discouraged!
Bonus SaaS KPI: Churn
What would an article on SaaS KPIs be without churn? That’s the metric that keeps us up at night J . Churn means how many customers or MRR one loses per period. Roughly speaking, if you have gained 100 customers and lost 10 per year, the churn is 10%.
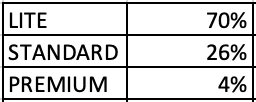
We were in a privileged situation from the beginning; our churn was and remains relatively low. Naturally, we lose subscribers all the time. Still, such customers are mainly from the lowest package (Lite = 29 euros/month) and have a low impact on our MRR. Recently, however, we lost a customer whose MRR was almost 600 euros, which hurts. Here are our churn figures by package:

Churn can have many reasons. In our case, there are mainly two:
- The customer has no traffic
- The customer cannot integrate the results into the daily sales routine
Seldomly, a mean one occurs: technical churn. Technical churn often happens when a company’s credit card has expired. Customers are notified about this by the payment system and us but decide against renewing their subscriptions.
How to minimize churn:
- Permanent product improvement (the competition keeps on improving either)
- Key account management, especially for customers with bigger tickets
- Early warning system (user has not logged in for some time)
- Educate customers, i.e., explain how to use or integrate the product into the company’s processes.
In short, your product must deliver on the promise that won your customers (added value, problem-solving, etc.). Only then will customers remain active or migrate sooner or later.
SaaS KPIs: Summary
This article is not exhaustive, and there are all kinds of metrics and calculation methods. There are many blogs and experts that focus exclusively on the SaaS KPIs topic. You will find some of them which we recommend you for reading below. In contrast, we tried to show which KPIs are essential in our day-to-day SaaS operations and how we optimize them. We hope it will make your business life a bit easier.
Here’s the promised list:
https://databox.com/metrics-every-saas-company-should-track
https://www.invespcro.com/blog/saas-metrics-kpis/
https://accelerateagency.ai/saas-kpis
https://neilpatel.com/blog/5-metrics-for-saas/
Image source: https://www.flickr.com/photos/182229932@N07/48545113627

